Table of contents
You wake up, glance at your Apple Watch, Oura Ring, Garmin, or WHOOP, and see a resting heart rate that looks a little different from yesterday. Maybe it's 62. Maybe it's 78. Maybe it jumped after a rough night of sleep, a hard workout, or a stressful week, and now you're wondering whether that number means anything at all.
It does. But not in the way most “normal range” charts make it seem.
A lot of people search for resting heart rate by age because they want a clean answer. They want to know if their number is good, bad, or somewhere in the middle. The problem is that the common 60 to 100 beats per minute range is useful for screening, but not very useful for coaching your actual health. It tells you what's broadly accepted as normal. It doesn't tell you whether your heart is efficient, whether your fitness is improving, or whether your wearable is picking up early stress in your system.
Think of resting heart rate as a low-noise health signal. It reflects how hard your heart has to work when your body is doing almost nothing. Like an engine idling at a stoplight, your heart's “idle speed” tells you something about efficiency. A lower idle, in the right context, often means the system is running smoothly. A higher idle can mean the body is compensating.
Your Heart Rate Is a Story Not a Snapshot
You probably don't need another article telling you to put two fingers on your wrist and count beats. Context is often what's needed.
A single resting heart rate reading can be misleading. If you had poor sleep, drank alcohol, got sick, trained hard, or spent the whole week in back-to-back meetings, your number may shift without meaning anything permanent. That's why your resting heart rate works better as a story than a snapshot.
What that morning number is really saying
If your wearable says your resting heart rate is higher than usual, your body may be signaling that recovery isn't complete. If it trends down over time while energy, sleep, and exercise consistency improve, that usually points in the right direction.
Your heart doesn't beat in isolation. It responds to fitness, stress load, sleep depth, hydration, illness, and metabolic strain. So the number on your wrist isn't just about your heart. It's a summary signal for how your whole system is coping.
Many readers often get stuck at this point. They ask, “Is 72 good?” The better question is, “Is 72 normal for me, and where is it heading?” A stable trend at one level can mean something very different from a rising trend to the same level.
Why age matters, but not by itself
Age does influence how people interpret resting heart rate. So do sex, training level, and life stage. A fit adult with a low resting rate may be showing strong cardiovascular efficiency. A sedentary adult with a higher reading may still be inside the clinical normal range, but not necessarily in an optimal zone for healthspan.
That difference matters. “Normal” means not obviously abnormal. “Optimal” asks a different question. It asks how well your body is functioning, and what direction it's moving in.
Understanding Your Heart's Idle Speed
Resting heart rate is the number of times your heart beats per minute when you're fully at rest. The easiest way to understand it is to compare it to a car engine idling in park. The car isn't speeding down the road, but the engine is still running to keep the system going. Your heart does the same thing.
If your heart can move enough blood with fewer beats, that usually points to better efficiency. If it needs more beats to do the same basic job, the “idle speed” is higher.

How to measure it manually
Manual measurement still works well if you do it right. The biggest mistake is measuring when you're only “kind of resting.”
Use this approach:
Choose a quiet moment: Measure first thing in the morning before coffee, emails, or movement around the house.
Use your wrist or neck: Find your pulse at the radial artery on the wrist or the carotid artery in the neck.
Count carefully: Count beats for a full minute.
Repeat on a few mornings: One reading can be noisy. A small series is more useful.
If you stand up, walk around, talk, or check it after climbing stairs, you're no longer measuring a true resting rate.
How wearables usually do it better
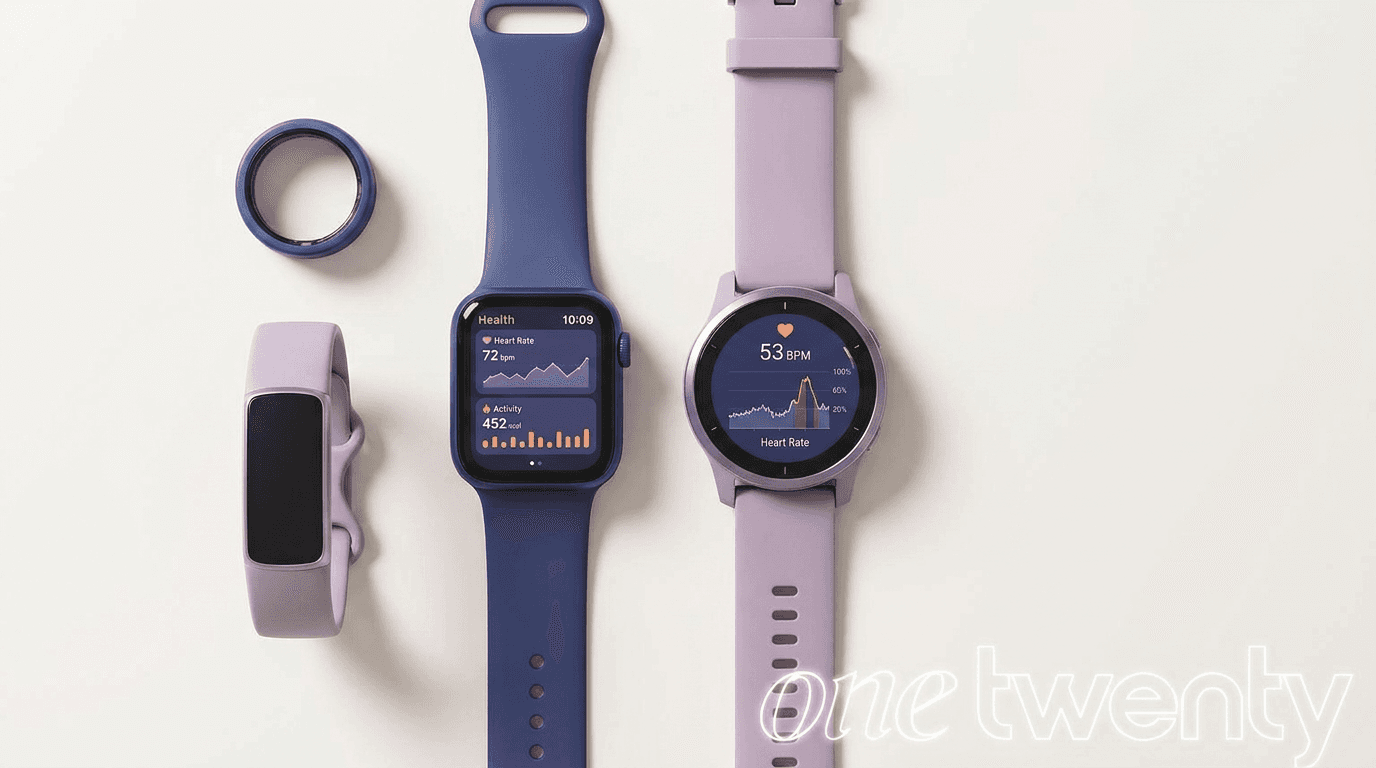
Modern wearables often give a more useful picture because they collect data repeatedly, especially during sleep. Devices like Apple Watch, Oura Ring, Garmin, and WHOOP can spot your lowest or most stable overnight heart rate. That's often closer to your true baseline than a random daytime pulse check.
What to look for in your app:
Overnight values: These are often the cleanest readings.
A weekly average: Better than reacting to one night.
Context markers: Sleep, strain, illness, travel, and recovery notes help explain shifts.
If your data seems erratic, check the basics first. Was the strap too loose? Did the watch shift during sleep? Did you wear it inconsistently? Clean input matters before interpretation.
Normal Resting Heart Rate Charts by Age and Gender
For adults 18 and older, the broadly accepted clinical normal resting heart rate range is 60 to 100 bpm according to the Cleveland Clinic guide to heart rate. That same source notes that a more useful “good” range for many healthy adults is 55 to 85 bpm, and that women typically average 78 to 82 bpm while men average 70 to 72 bpm.
That's the first big distinction most charts miss. Clinical normality is wide. Functional health is narrower.
A more useful chart
Age Group | Clinical Normal Range | Optimal Range (Non-Athlete) | Highly Fit / Athlete |
|---|---|---|---|
18+ adults | 60 to 100 bpm | 55 to 85 bpm | 40 to 60 bpm |
Older adults 55+ | 60 to 100 bpm | 60 to 80 bpm | Qualitatively lower if well-trained and asymptomatic |
The athlete range comes from observations that well-trained people often have resting heart rates of 40 to 60 bpm because training improves cardiac efficiency, as described in the Cleveland Clinic overview. For older adults, some guidance narrows the healthier target to 60 to 80 bpm, as discussed in UT Physicians' explanation of heart rate ranges.
What readers usually get wrong
Many people see 60 to 100 bpm and assume that if they're at 92, there's nothing to think about. Clinically, that may still sit inside the accepted range. But that doesn't automatically mean it's an ideal place to stay, especially if the number is persistent and not explained by illness, medication, or acute stress.
Online, “resting heart rate by age” often gets oversimplified. The useful question isn't only whether your value is technically normal. It's whether it fits your age, sex, fitness level, and trend.
For a healthy non-athlete adult: Mid-range values inside 55 to 85 bpm are often a more practical benchmark.
For a highly trained person: A lower number can be expected and healthy.
For older adults: A value that drifts above the narrower target may deserve more attention than a generic chart suggests.
For women: Average resting heart rate tends to run higher than for men, so comparisons should be sex-aware.
Why this chart needs context
A woman with a resting rate near the high end of the female average may be entirely different from a man with the same number. A fit 60-year-old can also have a more favorable resting heart rate than an inactive 30-year-old. That's why age-only charts are incomplete.
If you also track recovery, it helps to compare resting heart rate with other signals. This is one reason many people look at HRV by age benchmarks alongside resting heart rate, because the two metrics often tell a fuller recovery story when interpreted together.
Factors That Influence Your Daily RHR
A resting heart rate isn't fixed. It's responsive. That's useful because it means your data can tell you when your body is adapting well and when it's under strain.
Some influences are long-term, like training status. Others are immediate, like poor sleep or dehydration. The key is learning which changes are noise and which are patterns.

Fitness changes the baseline
People with high cardiovascular fitness often have lower resting heart rates because each beat moves more blood. In well-trained athletes, 40 to 60 bpm can be a normal adaptation rather than a warning sign, as described in Everlywell's review of resting heart rate by age and gender.
That doesn't mean lower is always better in every context. It means lower can be healthy when it matches the person. For an endurance-trained runner, a low resting rate may reflect efficiency. For someone who feels faint, dizzy, or unwell, the same number needs medical context.
Recovery habits move it day to day
If your wearable shows a bump after a late meal, travel day, rough night, or emotionally draining week, that fits what many people see in real life. Resting heart rate often rises when the body is working harder behind the scenes.
Common drivers include:
Sleep disruption: Broken or shallow sleep often pushes the next reading higher.
Stress load: Mental strain can keep your system in a more activated state.
Hydration: Even mild under-recovery can make the heart work a bit harder.
Illness: A rising resting heart rate can be one of the earliest signals that something is off.
Hormonal shifts matter more than many charts admit
This is one of the biggest blind spots in standard guides. Many charts treat age as if it were the only meaningful variable. It isn't.
Guidance from Cardiac Care Associates on women's normal heart rate patterns notes a 5 to 10 bpm increase that is common in women during perimenopause and menopause. That change can make wearable data look alarming if you don't know it's a plausible physiological shift.
For many women, that means a rising resting rate in midlife doesn't automatically point to sudden pathology. It may reflect hormonal transition. The practical move is not to ignore it, but to interpret it with more nuance. Compare it with sleep, symptoms, exercise tolerance, and longer trends rather than reacting to one week of data.
How to Interpret Your RHR Trends From Wearables
Wearables are most valuable when they turn scattered readings into patterns. If you only check your resting heart rate once in a while, you miss the full advantage of continuous tracking.
The better use case is trend interpretation. You want to know whether your baseline is drifting down, climbing up, or holding steady under similar conditions.

What a downward trend usually means
If your resting heart rate gradually drops while your sleep is solid and your training is consistent, that's often a good sign. Everlywell's wearable-focused guidance notes that a 5 to 10 bpm reduction over 3 to 6 months of training can signal improved cardiovascular efficiency.
That's a useful benchmark for people starting an exercise plan or rebuilding fitness after a sedentary stretch. It reframes progress. You're not only chasing weight, pace, or calories. You're improving how economically your heart works at rest.
What an upward trend deserves
A short spike can happen after travel, poor sleep, a hard training block, or getting sick. What matters more is persistence.
The same Everlywell analysis says a persistent elevation above 80 bpm in a non-athlete adult warrants investigation for possible metabolic or autonomic issues. That doesn't mean panic. It means don't wave it off if it stays there.
Use a simple decision filter:
Down for weeks to months: likely improved fitness or recovery capacity
Up for a few days: look at stress, sleep, hydration, alcohol, training load, or illness
Up and staying up: talk with a clinician and review the broader picture
How to make your wearable data more trustworthy
Interpretation gets better when the hardware fits and the data is consistent. If your watch shifts around at night, skin contact changes and readings can get noisy. If you wear an Apple Watch or Garmin daily and want a more secure fit for overnight tracking, it can help to find your ideal silicone watch strap so the sensor sits comfortably and consistently.
Device choice also matters. Some people prefer a ring for overnight data. Others like a watch because it captures workouts and daytime context in one place. If you're comparing options, a guide to suggested wearables for health tracking can help you match the device to your habits instead of buying on brand alone.
Actionable Steps to Optimize Your Resting Heart Rate
If your resting heart rate is higher than you'd like, the goal isn't to chase the lowest possible number. The goal is to improve the systems underneath it.
That matters because expert cardiovascular analysis summarized by MedicineNet's discussion of a good resting heart rate places a more functional optimal benchmark for healthy adults around 55 to 85 bpm, and notes that values consistently above 80 bpm are associated with higher long-term risk. The action point is simple. Build the habits that make a lower, steadier resting rate more likely.
Build a stronger aerobic base
Regular aerobic work is one of the clearest ways to improve cardiac efficiency over time. You don't need elite training. You need consistency.
A practical approach:
Walk briskly or cycle regularly: Pick something you can repeat.
Favor sustainable effort: You should be able to breathe and talk in short sentences.
Track trends, not hero days: One hard session won't transform your baseline. Repetition will.
Improve the recovery side
Many people train harder when they should recover better. Resting heart rate often exposes that mismatch.
Try this recovery checklist:
Protect sleep timing: Going to bed and waking up on a stable schedule helps more than chasing “perfect” sleep once a week.
Use calming inputs: Slow breathing, meditation, quiet walks, and reduced evening stimulation can support a lower resting state.
Hydrate early: Don't wait until late afternoon to notice you've barely had fluids.
If you want a practical companion resource, Qaly has an essential guide to a healthy heart rate that walks through lifestyle levers in plain language.
Pair resting heart rate with another performance signal
Resting heart rate gets more useful when paired with another metric that reflects recovery or cardiovascular adaptation. One strong option is heart rate recovery tracking, which can add context when your resting rate changes and you want to know whether conditioning is improving.
Your best move isn't to obsess over a single target. It's to create conditions where your heart doesn't need to idle high all the time. Better aerobic fitness, better sleep, lower stress load, and better recovery habits usually move the number in the right direction.
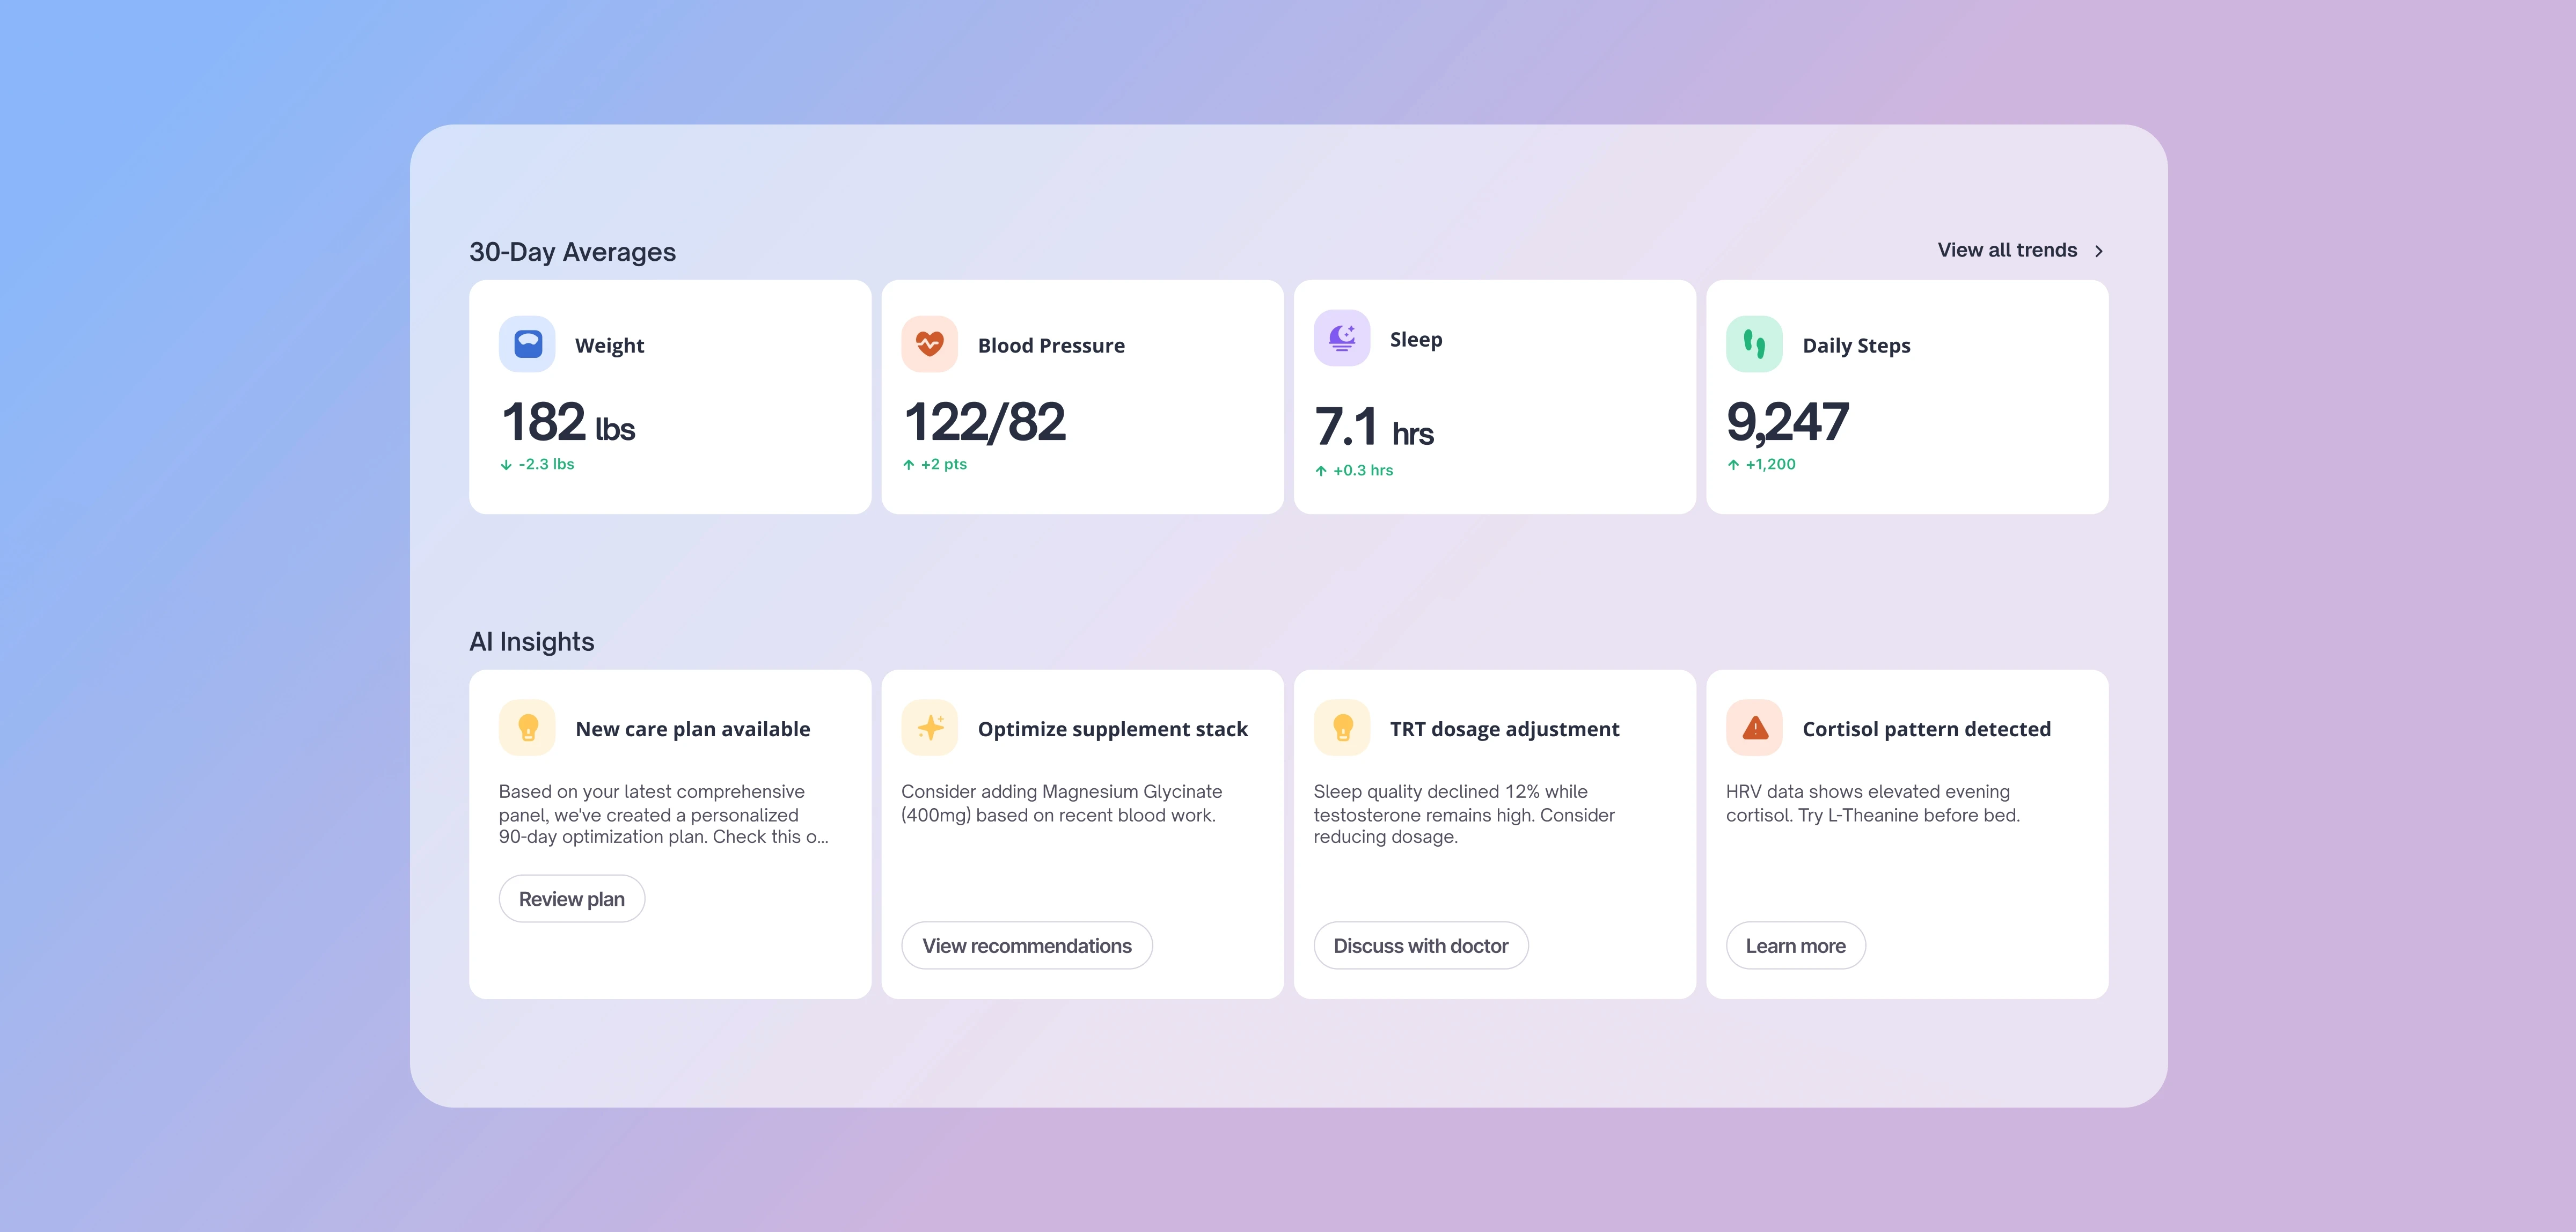
OneTwenty helps you connect wearable trends with lab testing so you can see whether changes in resting heart rate reflect fitness gains, stress load, metabolic strain, or something worth a closer look. If you want a more complete view of your biology, explore OneTwenty.

How OneTwenty Works
Not your average
Checkup.
Every life stage brings new biological demands. Tracking the right metrics at the right time helps you adapt, optimize performance, and extend both lifespan and healthspan.
Your Annual Physical
Manual Data Processing
Guesswork Trend Detection
Once-a-year physical
Reactive, tested when sick
No data between visits
Once a year testing
Delayed Results
One-size dosing, set and forget
Real-Time Trend Insights
Daily smart-device data
Automated Data Sync
Quarterly Biomarker Tests
Optimal, personalized targets
Plain-language AI insights
Medications titrated to your data
Built to extend healthspan

Frequently Asked Questions
Clarity before
you commit
Answers on setup, scale, and support to remove blockers.